
NB this blog now includes free downloadable spreadsheet tool, to enable you to calculate your pupils' progress and school progress score - scroll to the bottom to access.
The DfE has now published its technical guidance on the calculation of KS2 progress scores. I am pleased to report that the assumptions I had made and discussed in this previous blog were correct.
The model is the same in principle as the previous model, i.e.:
- pupils are placed into Prior Attainment Groups based on the teacher assessments they were awarded at KS1 in reading, writing and maths
- this is done by allocating a score to each teacher assessment category and then calculating the average score across the three subjects
- as before, this is not a straightforward average of the three, but double-weights the maths score (or, as DFE put it, reading and writing are first averaged to produce an ‘English’ score, then this is averaged with the maths. Technically this amounts to the same thing as double-weighting maths)
- by analysing the national dataset, the DfE determine the average KS2 scaled score outcome for each prior attainment group
- the progress score, for an individual pupil, is the difference between the actual scaled score they achieved and the national average score achieved by children in the same prior attainment group
- the school’s progress score is the average of all its pupils’ progress scores
Some key points to remember:
- There is a lot of averaging going on in the model described above. Averages can be useful up to a point, but we must remember that by definition, there must always be some children achieving above the average and some achieving below. This is what in game theory is known as a ‘zero-sum game’: for every child with a +1 progress score, there is another with a -1 score. The average across all children, across the whole country, is (by definition) zero. This is not a system in which everyone can appear to have made ‘good progress’ (if we were to define ‘good’ as meaning above average).
- Averages tell us nothing about the spread (range) of the data. A school may have a positive progress score, but within that cohort there may be some pupils with very low progress scores. Conversely, a school may have a negative score, but within that cohort some pupils might have made great progress. Scattergraphs (such as those shown in Analyse School Performance) are useful for visually seeing the spread of the data, as a starting point for a discussion about the performance of particular individuals.
So, how does the calculation work and what does it mean for schools?
For a full description of the model, refer to the technical guidance, but in a nutshell here are some key points.
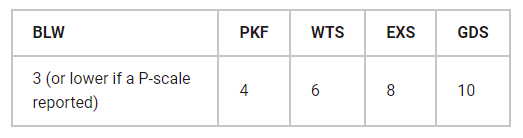
Key Stage 1 teacher assessments are converted to a point score as follows:
Let’s take an example imaginary child (Child A) and say that at KS1 they were assessed as follows:
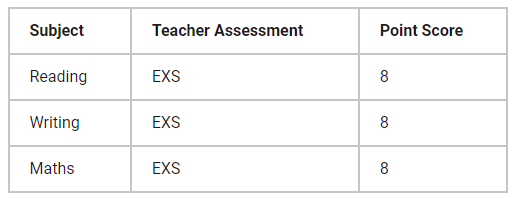
In this case, it’s fairly obvious to see that this child’s average point score is 8. Their progress score at KS2 is then dependent upon how their outcomes compare to the average outcome of other children with a KS1 point score of 8.
In 2022, those average outcomes (for this particular prior attainment score) are as follows:
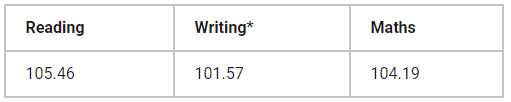
So, if Child A attains a scaled score of 107 in reading, their progress score will be +1.54 (107 subtract 105.46).
If, however, Child A had achieved a score of 100, it should be noted that, whilst they would have attained the expected standard, their progress score would be -5.46 (a very significantly below average score). So it is not as simple as saying that as they achieved EXS at KS1 and then also achieved EXS at KS2, their progress is average. If their scaled score is in the lower half of the range of scores that make up the Expected Standard, their progress will be below average.
* Writing at KS2 is a teacher assessment. For the purposes of calculating progress scores (and for no other purpose) scores are allocated to the KS2 teacher assessment categories. EXS is given 103 points – so in our above example, if Child A achieves EXS in writing, they will have a progress score of +1.43 (103 subtract 101.57).
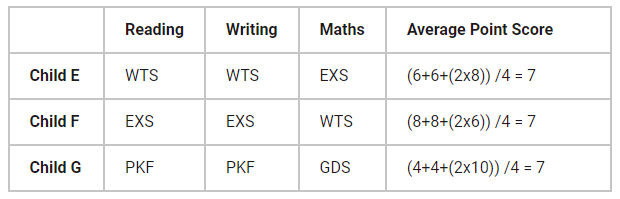
Bear in mind that there are other ways of arriving at a prior attainment score of 8 (some of which are less likely to occur than others). Here are some other fictional example children, all with the same prior attainment score as our Child A.
Remember the weighted average is calculated as (R+W+2M) / 4.
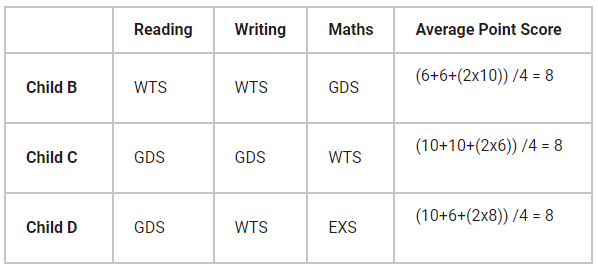
The average prior attainment score, based on all three subjects at KS1, is the one that is used in the progress model for each subject area. So Child B, a strong mathematician at KS1 but with below average literacy skills, still needs to hit those same scaled score benchmarks shown above (105 for reading etc) to attain ‘average progress’. The model treats our example children A, B, C and D as a homogeneous group, even though they are clearly very different.
For the full detail on this model and how it works for every prior attainment score, refer to the DfE technical guide (or see the downloadable spreadsheet below). One other useful point of reference, though, is this one – the national average outcomes for children assessed at GDS in all three of reading, writing and maths at KS1 are as follows:
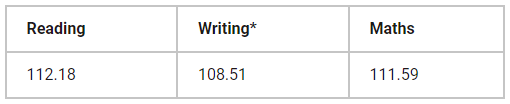
So, for a child assessed at GDS across the board at KS1, positive progress scores are only achieved if they attain a reading scaled score of 113 or higher, or 112 in maths.
* EXS in writing is scored as 103; GDS is scored as 113. Clearly it is not possible therefore for an individual child to score 108.5. If they are assessed at EXS, their writing progress would be -5.5. If they are assessed at GDS, the score would be +4.5. This only begins to make sense when you amalgamate the data and look at the whole cohort or groups of children. If you had 10 children with this prior attainment score, and half of them achieve GDS in writing and the other half EXS, their average progress score would be 108 – pretty much in line with the national average.
Important point to remember – the national averages are recalculated every year, so you can’t assume that the 2022 model will be the same in 2023.
In fact it will have to change anyway, because the ‘PKF’ standard (Pre Key Stage Foundations) that was in place in 2018 was replaced in 2019 with Pre Key Stage standards 1 to 4. So the 2023 KS2 progress model will need to be adjusted to take account of that.
Beyond 2023, there will then be two years of no progress data at all, because there will be no KS1 data to measure from (arising from the cancellations of statutory assessment due to Covid). Then, in 2026 and 2027, we will have progress data again, measured from KS1, before another big change: in 2028, the plan is that KS2 progress will be measured from pupils’ performance in the Reception Baseline Assessment (taken in academic year 2021/22). So it’s an ever-shifting landscape.
One final point of interest: in ASP and the IDSR, statements are made about the performance of ‘low prior attainers’, ‘middle prior attainers’ and ‘high prior attainers’. In this system, those 3 groups are defined as follows:
Low PA = an average point score below 7
Middle PA = an average point score from 7 to 8 inclusive
High PA = an average point score above 8
The example children A to D discussed in this piece would all fall within the Middle PA group, but so too would children with KS1 results like this:
(Again, some of these attainment profiles may be less likely to occur than others, but all are technically possible.)
Remember that these three broad prior attainment bands are merely ways of slicing the dataset – they are not what is used in calculating pupils’ progress scores. Those calculations are based on the more precise prior attainment groups (of which there are 19).
But it is useful to remember, when reading a statement in an IDSR about the performance of a particular prior attainment group, how diverse the children who make up that group can be. (If you enter your pupils' data into the spreadsheet below, it will show you which children are in which prior attainment category.)
Finally I want to close by reiterating the point that I made in this blog - there are just three points in time where we attempt to represent progress as a numerical measure: once in primary school (KS2 progress scores) and twice in secondary school. We should not seek to create numerical progress measures at other points in time in a child’s education journey – to do so would not be statistically valid. Instead, to evaluate progress, we need to focus our attention on children’s journeys through a well sequenced and appropriate curriculum. For more thoughts on this, please read “What do we mean by ‘progress’ and how can we reassure ourselves that pupils are making it?”
Ben Fuller