The Inspection Data Summary Report (IDSR) has undergone another round of changes in presentational format this year. It has been slimmed down and simplified from last year. There are a number of changes – a full list can be found here – but I am focusing specifically on its presentation of pupil outcomes data, i.e. attainment and progress.
Perhaps the most significant point is the removal of all previous years’ attainment/progress data. Only the latest data is displayed (albeit with significant improvement/decline relative to previous years being indicated).
The new IDSR is, on the whole, a very easy-to-understand document and it is important to note that this is the only source of attainment and progress data that Ofsted use when inspecting a school. They do not refer to the Analyse School Performance (ASP) website at all.
However, when it comes to school leaders (including governors) making effective use of data to understand where the school is most successful and where they might need to focus for further development, it is worth noting that there is a lot more information in the ASP than in the IDSR. However, it is also the case that there is some information included in the IDSR that is not in ASP!
ASP includes outcomes data (attainment and, where available, progress) for various pupil groups (disadvantaged learners, those with SEND, those with English as an Additional Language etc) – no matter how many children are in those groups within a particular school. (Of course, one needs to be cautious about reading too much into an outcome that is based on a very small number of children, as it could be very much driven by the performance of an individual learner.) IDSR only reports on data where it can be considered meaningful (i.e. based on at least 11 children) and/or statistically significant.
However, when it comes to supporting the user with interpreting the data, there is one major thing that the IDSR does that ASP does not do – and that is provide statistical significance indicators and percentile ranks for all the major indicators. ASP indicates statistical significance only for KS2 progress scores – not for any attainment measures.
So, in the IDSR (towards the end of the report) there is a section that looks like this:
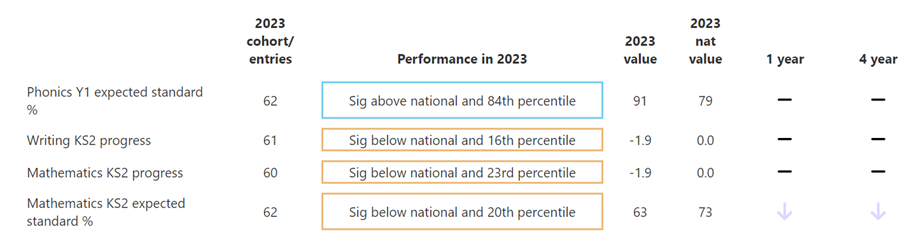
This will list any of the indicators (KS2 attainment or progress, KS1 attainment, Phonics Y1 attainment) where the school’s outcome is statistically significantly above or below the national figure. (See below for more on ‘statistical significance’.)
It also shows the percentile rank. NB the producers of this report have decided to switch which way round the percentile rankings are presented. Unlike previous versions of this report or its predecessor, the rank is now shown such that the higher the number, the better the outcome, with the 100th percentile indicating schools in the top 1%.
The report also indicates (using arrows) if the school’s outcome has changed significantly from last year or from 2019 (pre-Covid).
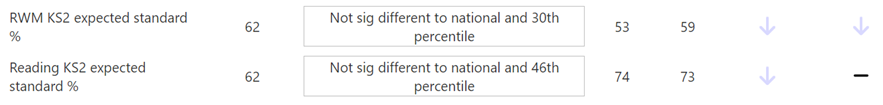
Below this, there is a link to the ‘Non-significant data’ – where you can see all the outcomes that are not deemed to be statistically significantly different to the national figure. However, just because these figures are not deemed statistically significant, does not mean that this data might not be interesting or worthy of some discussion or exploration. If one takes a healthy view of data as being a useful starting point for raising questions, rather than leaping straight to a judgement or conclusion, it can still be useful to look at this ‘non-significant data’. For example, there may still be arrows indicating a statistically significant improvement or decline in the school’s outcome relative to its previous position – as in the two examples below.
A reminder about the meaning of statistical significance
As I mentioned in this previous blog, Measuring progress across Key Stage 2 – this year and beyond in the world of statistics, the word ‘significant’ has a very precise meaning, which is not the same as the way it is used in everyday speech. It is really about expressing a degree of confidence in the assertion that is being made – in other words, if a result is deemed to be ‘significantly above average’, that means that we can say with a high degree of confidence that the result is better than the national average. It is not an expression of how much above the average, just that it is above.
ASP is helpful here in that it displays the ‘confidence intervals’ that are used to determine this. See the example below.
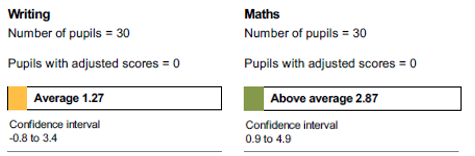
In the case of the progress score for maths, we can say with confidence that it is better than the national average (which is zero) by looking at the confidence interval (0.9 to 4.9). This is telling us that we can say with a high degree of confidence that the progress score is somewhere in the range of 0.9 to 4.9. Exactly where within that range the true value lies is not possible to say, but even at the lowest end of that range (0.9) it is still above zero and that’s why we can say with confidence that progress is above average.
By contrast, in the writing example, the progress score could be as low as -0.8 or as high as 3.4, so we can’t say confidently whether it is above or below zero – even though the mid-point of that range (the figure of 1.27, shown in the main box) is clearly above.
However, as mentioned above, it is only for these headline KS2 progress indicators where ASP displays confidence intervals and thus indicates statistical significance in relation to national figures. IDSR provides the significance indicators for the full range of outcomes, but not the confidence intervals.
It is worth reiterating the key message that data is just one small piece of the jigsaw when it comes to understanding the effectiveness of a school and it should therefore always be triangulated with the qualitative evidence that can only be gained by visiting a school, talking to children about their learning and looking at the work they have produced and talking to school leaders about their curriculum vision.
For more information on the place of assessment within the Ofsted framework, see this blog The place of assessment in the new Ofsted Framework (updated for Autumn 2023) and for a reminder on what we really mean by ‘progress’ and how we can attempt to evaluate it, refer to this piece What do we mean by ‘progress’ and how can we reassure ourselves that pupils are making it?
Ben Fuller