The first version of the 2024 IDSR has now been released. For primary schools this includes a release of provisional 2024 attainment data. On first glance the report looks very similar to last year’s, but on closer inspection there are a few subtle differences.
Before I unpick what’s changed, firstly a reminder that (as far as attainment is concerned) this report is the only data Ofsted use as part of the inspection process – and even then, its use is simply as a starting point. It is possible that key lines of enquiry may emerge as a result of the data shown in the IDSR.
Ofsted will not look at any internal data that the school may hold on pupil attainment. However, we have seen an increased focus on absence and exclusion data and Ofsted may well request more up-to-date information that the school holds on these.
And so, to what has changed in this year’s report.
Absence and exclusion data
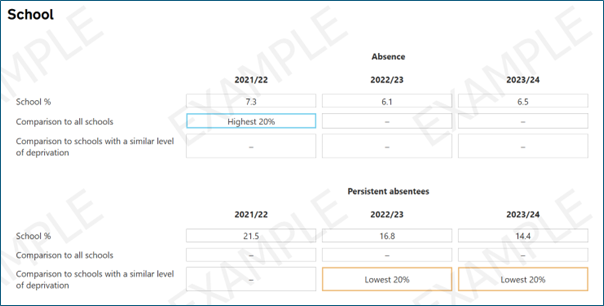
As stated above, these are important focuses in any inspection and in these areas the IDSR has become more detailed this year. There are now tables displaying the data for each of the following indicators across a 3-year period:
- overall absence
- persistent absence
- total number of suspensions across the school
- number of children with 1 or more suspensions, 2 or more suspensions and 10 or more suspensions
- number of permanent exclusions across the school
For most of the above indicators, there is also an indication if any of the school figures are in the top or bottom quintile nationally, or when comparing to similar schools. Similar schools are those with a similar level of deprivation. See example below.

Throughout the report, blue boxes are used to indicate something being in the highest 20% (i.e. the top quintile) of the range of the data, and orange boxes indicate being in the lowest 20% (bottom quintile). Of course, when looking at attainment data, a blue box is therefore a very nice thing to see – but the opposite is true when looking at absence or exclusions.
Ethnicity data
There is a change in the way the ethnicity of your pupil population is displayed. Previously, only groups that represented at least 5% of your pupil population were displayed. Now all groups are displayed with a national comparison.
Attainment data
The differences in what is displayed here are mainly a consequence of what data is (and isn’t) available this year. Key Stage 1 assessment ceased to be statutory this summer, so there is no KS1 attainment. And, because statutory assessment was cancelled in summer 2020 due to Covid, there are no KS2 progress measures this year. (Neither will there be next year. At KS4, this will apply to Progress 8 measures in 2025 and 2026.)
Therefore, the table of outcomes now shows (at the time of writing) just the KS2 attainment and Year 1 Phonics Screening Check. (Data on the Multiplication Tables Check is expected to follow.) Don’t forget to click on the ‘Non-significant data’ drop-down arrow in order to see the full dataset. See example below.

As per last year, this summary of performance across key attainment indicators tells you two interesting pieces of information that you can’t find anywhere in the Analyse School Performance website – those being: whether or not each indicator is statistically significantly different to the national norm and whereabouts (in terms of percentile rank) each indicator lies in the national distribution.
Each row of the table may also (potentially) show 1 or 2 arrows. Any significant change in the outcome compared to the previous year will be indicated with an arrow, provided the cohort consists of at least 11 pupils. Arrows are shown comparing 2024 outcomes to 2023, and comparing 2023 to 2022. The IDSR does not display any reference to attainment before 2022.
NB although any indicator where the outcome is not statistically significantly different to the national figure in 2024 is relegated to the ‘Non-significant data’ zone, such indicators may still display arrows indicating significant changes from previous years.
Pupil groups
Last year, in attainment indicators, significant differences in outcomes for specific pupil groups were displayed in the case of socio-economically disadvantaged groups (FSM6 and/or CLA) and for prior attainment groups. This year, in the case of KS2 data, there are no prior attainment groups (due to no KS1 assessment in 2020) so FSM6/CLA is the only pupil group that might be flagged up here.
NB the pupil group will only be flagged up if all these 3 conditions apply:
- the pupil group includes at least 11 pupils
- the outcome is significantly different to the national benchmark
- that difference does not fit the school’s general pattern of attainment
For example, if the attainment of children eligible for FSM in a school is significantly below average, but the school’s overall attainment is also significantly below average, that group will not be flagged in this section of the report, because it does not represent a difference to the overall pattern for the school.
However, if FSM attainment is significantly below average and overall attainment is not significantly below average, the group will be flagged up (provided the group size is at least 11 pupils).
As in previous years, the ‘national benchmark’ that is used when looking at attainment of FSM children is the national figure for non-FSM children (the inverse group).
It is worth noting this key paragraph from the IDSR guidance:
Differences between pupil groups can be meaningless when analysed at school level, particularly when the groups are small. The conversation should be about meeting the needs of all pupils.
Pupil groups may also be flagged up as having significantly different absence data to the rest of the school. The groups that may be flagged up here are FSM, SEN and EAL. The methodology is similar to that applied for attainment, although based on quintiles rather than on statistical significance. For example, if the percentage of SEND pupils who are persistently absent in a school is in the top quintile, but the school’s overall persistent absence data is not in the top quintile, the absence of SEND pupils would be flagged up here, as it is different to the school’s overall pattern.
This concludes my summary of changes in the IDSR from last year’s version – at least, those that I have spotted!
Remember, for advice and consultancy on any aspect of understanding your school data, you can get in touch with me via email.


